
Lily Yijie Zhou

Exploratory Data Analysis and Regression:
Air quality dataset analysis and humidity prediction.
Brief Introduction
This project is to analyze an air quality dataset. The data was obtained along a main road in an Italian city over 13 months.
The project goal is to use both linear and non-linear models to predict the absolute humidity by giving a temperature. And also compare the prediction results from partially cleaned data and mostly cleaned data. Matlab is the tool used in this project.
Steps
1. Data preparation: remove missing values and duplicates.
2. 1st time regression analysis and make predictions.
3. Further clean data: find outliers and remove outliers.
4. 2nd time regression analysis and make predictions.
5. Compare the 1st and 2nd predictions.
Outcomes
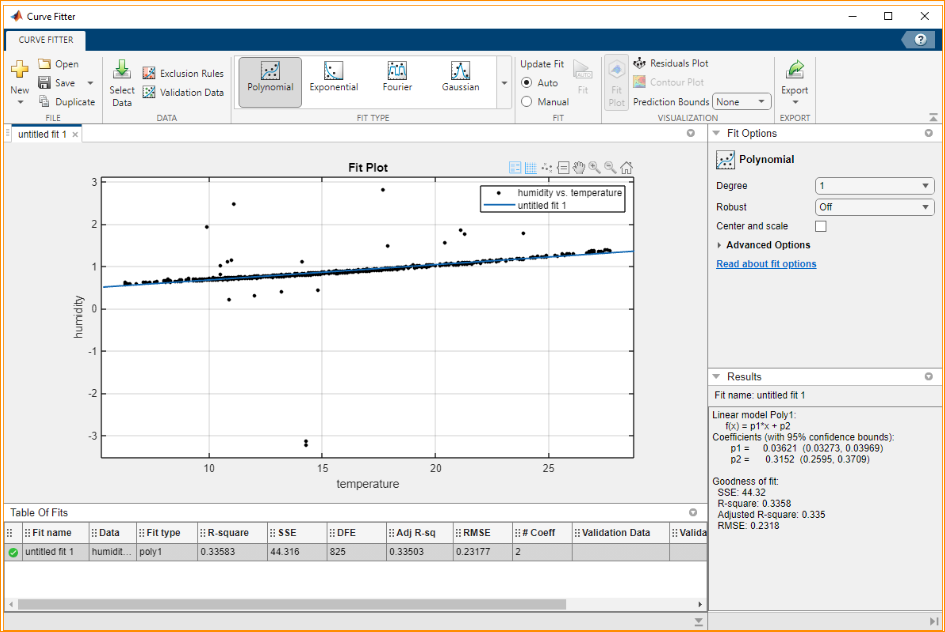
- 1st time Linear Regression:
The coefficient of determination (r square) is 0.3358, which is close to 0. Therefore, this is not a good fit.
The best fit line is: humidity = 0.3152 + 0.03621 * temperature
Predicted humidity is 1.58255 when temperature is 35 degrees.
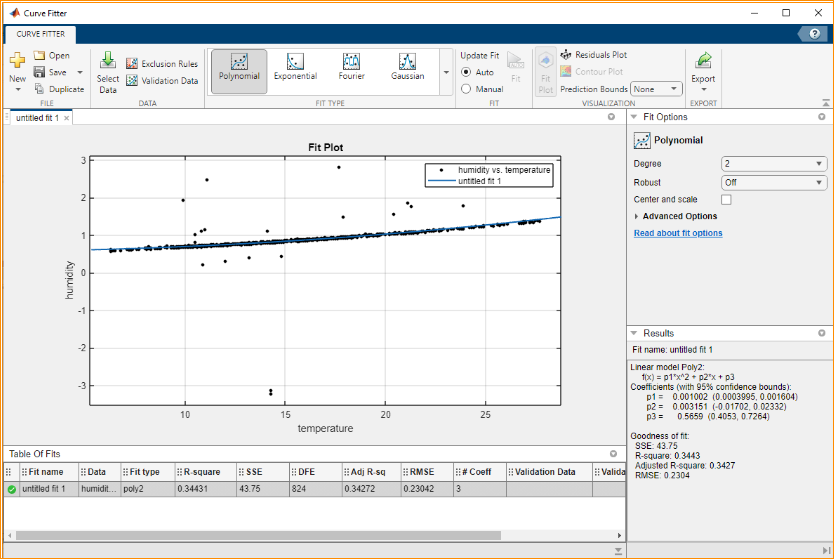
- 1st time Nonlinear Regression (2nd degree polynomial model):
R-square is 0.3443.
The equation is: humidity = 0.001002 * temperature^2 + 0.003151 * temperature + 0.5659
Predicted humidity is 1.9036 when temperature is 35 degrees.
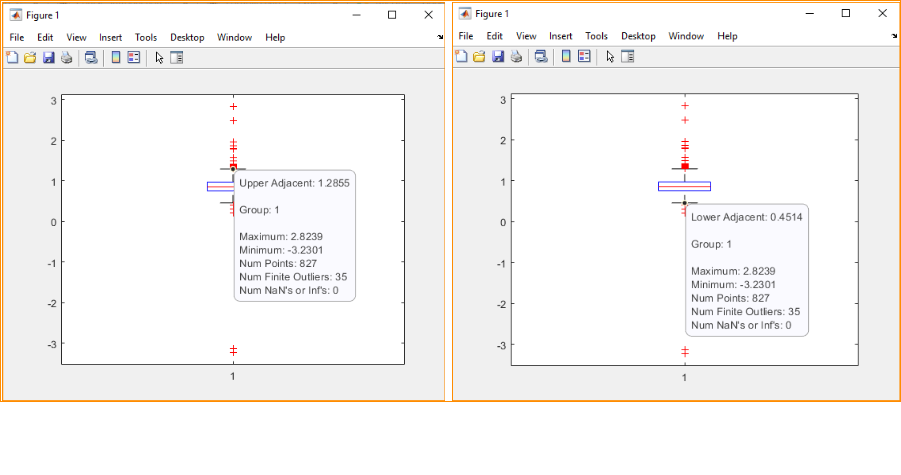
- Find outliers and remove outliers:
Use built-in function ‘boxplot()’ to find Upper Adjacent and Lower Adjacent.
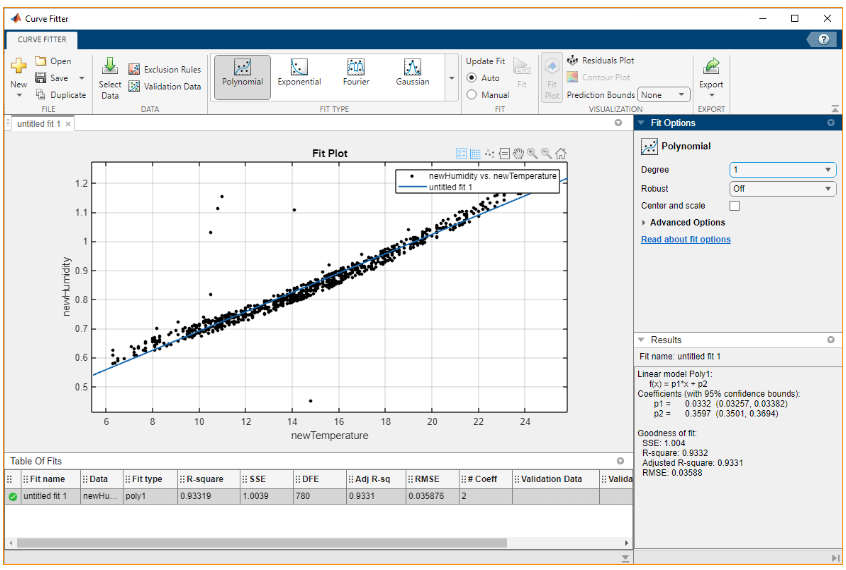
- 2nd time Linear Regression:
R-square is 0.9332, which is close to 1. Therefore, this is a fairly good fit.
The equation is:humidity = 0.0332 * temperature + 0.3597
Predicted humidity is 1.5217 when temperature is 35 degrees
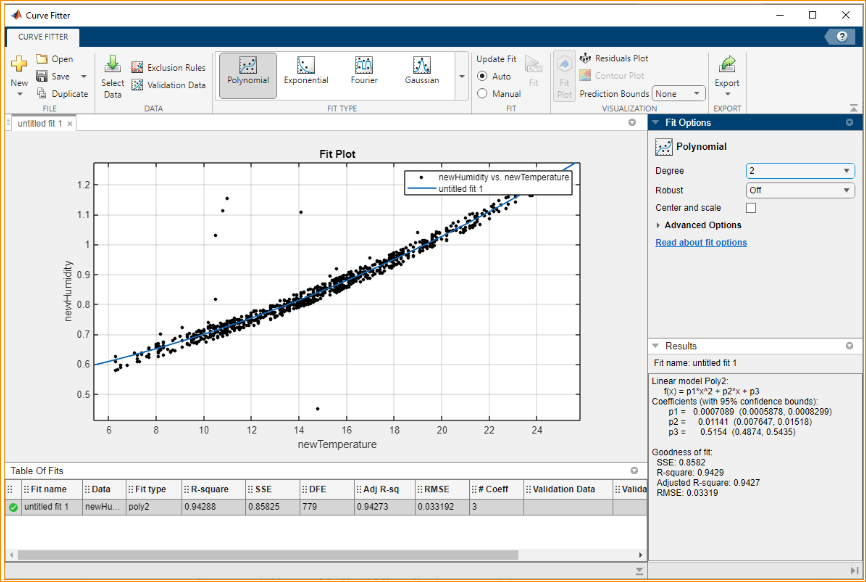
- 2nd time Nonlinear Regression (2nd Degree Polynomial Model):
R-square is 0.9429.
Model equation is: humidity = 0.0007089 * temperature^2 + 0.01141 * temperature + 0.5154
Predicted humidity is 1.7832 when temperature is 35 degrees
Removing outliers gives a significant improvement in both linear and non-linear models. Predictions can be very different from partially cleaned data and mostly cleaned data, it is more obvious in the non-linear models.